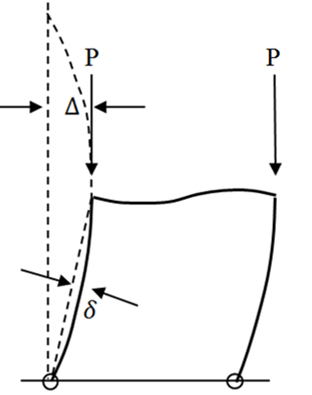
Nida checks the section capacity along the length of every initially curved member for P-δ effect, which is required by design code for member imperfection and member second-order effect. Other software only check the P-Δ effect at element ends which is inadequate for full second-order analysis. As the P-Δ and the P-δ effects have been considered in Nida, no effective length or λcr factor is required to be determined. 

The following second-order effects, which are required by most national design codes of practice, have been included in calculation of member forces and checking of member and system design strength, via a second-order analysis procedure.

41

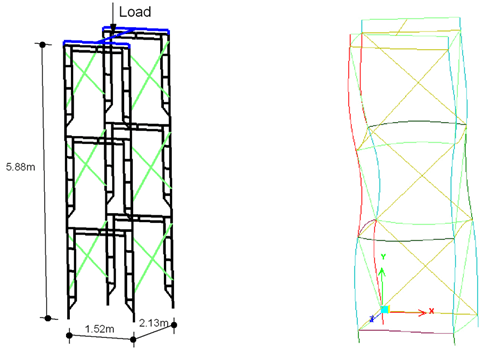
Figure1 The type "A" tested frame used for present studies

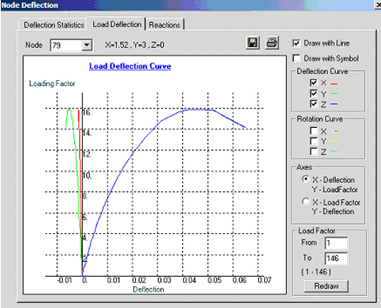
 Figure2 Load vs deflection curve for imperfection of 0.5% of scaffold height 

(1) The effect of member slenderness (Le/r) on the axial force capacity of a column and a strut.

(2) The change of member stiffness due to the presence of axial force. In other words, a member stiffness under axial compression will be reduced and it is accounted for in the analysis. For example, the compressive bracing member takes a much smaller load than the tensile bracing member. This checking will be required by some design codes that the effectiveness of a restraining member when under force should be considered.

(3) The effective length ratio (Le/L) or K-factor is automatically allowed for in the analysis and thus its assumption is not needed. No assumption or evaluation of effective length is required. Thus, the classification of sway and non-sway frames for determination of effective length ratio as required by some ultimate limit state design codes (e.g. BS59501) is not needed. Note that effective length can hardly be assessed accurately in many real cases.

(4) The global structural instability such as snap-through buckling, additional moment due to sway and P-Δ effects are considered in the incremental-iterative second-order analysis procedure.

(5) Reserve in strength after yielding can be explored with the second-order plastic Analysis. 

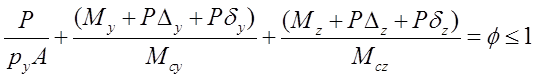
The design and buckling capacity of a structure can be computed by incrementing the loads until member failure, sensed by material yield or excess of sectional strength as

Eurocode and new LFRD advise us to use second-order analysis. BS5950(2000) advises us not to use the first-order linear analysis for slender frames in clause 2.4.2.7 as "If lcr is less than 4.0, second-order analysis should be used". Are we sure our structures will not have a lcr less than 4 and, shouldn't we use second-order analysis which is applicable to any value of lcr and will always give us a safer and a more economical design ? Euro code-III has also been recommending engineers in using second-order analysis. Are we behind in this race of technology ?  

Are we or our engineers equipped with this better and new design method recommended in national design codes in most countries with advanced technology ? Please spend a few minutes to check the following.

If we do not want our structures to failure before reaching the design loads, we or our engineers should at least be able to determine whether or not the following simple frame has the design strength to take a pair of point loads of 100 tons and 50 tons at its tops, coming from a point load of 150 tons at one third bay distance from one column top. One case is tied at top and the other case is not tied.

All columns : 203x203x60UC bent about minor axis : A = 7640 mm2. I=2.0x107mm4, Z=1.99x105mm3

Others : 152x152x37 UC bent about major axis : A = 4730 mm2. I=2.2x107mm4, Z=2.74x105mm3 

All steel grade S355. 

43 

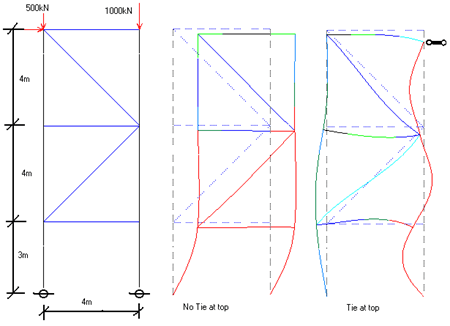
Our solutions are 126 tons for "no-tie" case and 207 tons for "tie" case (total load). Colour on each member of the frame on last page shows its design strength check.

Can your currently used software solve the problem in comply with the design code quickly ? If not, please consider using one which is capable of doing the second-order analysis with section capacity check to improve your competitiveness and safety of your design. 

44

A scaffolding system designed and analysis safely in Taiwan by Nida without using the code for member strength check and assumption of effective length. The design is completed within a few minutes.

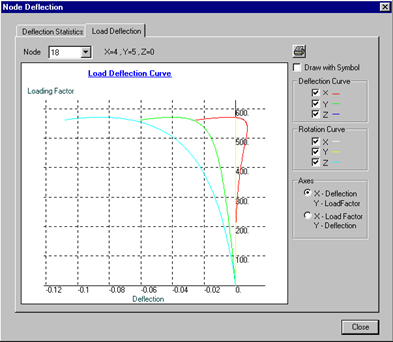
Both frames below have elastic critical load factors lcr less than 10 and larger than 4 and therefore their column use the same design chart in Appendix E of BS5950 (2000) for unbraced or sway frames. After reading the following large deflection plot, do you think they really behave similarly under the same set of increasing loads ?

45

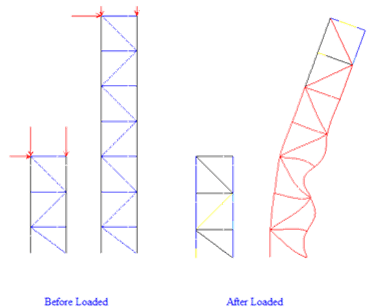
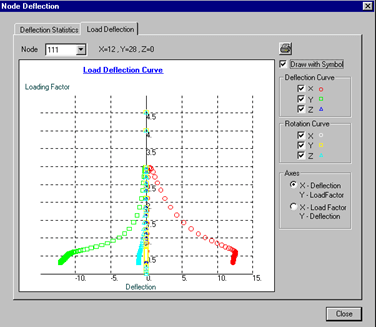
Figure3 Load deflection paths of node at top of taller frame

Elastic Critical Load Factor (lcr) is an indicator for buckling sensitivity of a structure. The larger the value is the less sensitive to sway buckling effect the structure is. It can also be used to compute the amplification moment (M) from the moment obtained by a linear analysis ( M') as, 

By definition, lcr is a factor multiplied to the design load to cause the structure to buckle elastically and drastically, such that the structure does not exhibit pre-buckling deflection. This condition is impossible to attain in practice since structures deform in all directions, no matter how small, once external loads are applied. As the large deflection and material yielding effects are not considered here, the factor is an upper bound solution that cannot be used directly in design. However, lcr is useful in assessing the stability condition. 

The following requirements are imposed in the CoPHK (2011).

(1) When lcr < 5, a structure must be designed by a second-order analysis discussed below (i.e. the P-Δ moment must be considered by a second-order analysis and the first-order linear analysis with or without moment amplification cannot be used)

(2) When 5≤ lcr < 10, the structure is sway-sensitive and moment must be amplified for the sway effect (i.e. the P-Δ moment must be considered and the first-order linear analysis with moment amplification method can be used) and

(3) When lcr ≥10, the frame is sway insensitive that the sway effect can be ignored (i.e. the P-Δ moment can be ignored)

lcr can be determined either by the deflection method in the CoPHK (2011) or in computer. In all cases, the P-δ moment must be considered in using imperfect member in analysis or the buckling curves in design code.

Second-order analysis can be used in all cases above.

20

 Figure1 The P-Δ and P-δ Moment

Background

In structural analysis and design, a suitable model to represent and simulate the true behaviour of a structure is necessary for obtaining an accurate output. The first-order linear analysis is based on the assumption of elastic material behaviour and undeformed structural geometry for equilibrium check. The elastic analysis does not fully comply with the requirements of the limit state design (LSD) philosophy and additional member check is needed to ensure nonlinear effects due to buckling and plastic failure do not occur under the design loads. Also, the use of plastic moment capacity in design and the adoption of an elastic analysis are inconsistent. More critically, buckling is system behaviour while the design check is member-based and they are not compatible with great uncertainty in effective length factor (Le/L).

A complete non-linear analysis traces the structural response until the limit state is reached with allowance for non-linear geometrical and material behaviour and imperfections. As such, the limit load from the analysis can be directly compared with the factored design load and individual member design becomes unnecessary. Because of this characteristic, the method is sometimes called the “Direct analysis” in the U.S.A. However, in order to simplify the complexity of an analysis, different versions of non-linear analysis are available. The engineer must therefore fully realize the limitation of any one of these versions otherwise disaster due to over-estimation of load resistance may occur. The P-Δ-only version of second-order analysis requires additional checks using the tables in the code and the software is not fully “automatic”. All software for second-order non-linear analysis, like the first-order linear analysis, requires careful input of data file and interpretation of data output. This section introduces the design concept for a second-order elastic and plastic analysis of steel frames used in many real projects. Below is a summary of these methods which are essential in understanding the new design theory.

First-order Linear Analysis

As other structural analysis software, NIDA plots the bending moment and shear force diagrams under the assumption that change in geometry under load does not affect the structural stiffness.

Second-order Analysis

In this second-order analysis, NIDA performs the following functions.

•    Calculate the displacements and rotations at all the nodes or junctions of elements or members, allowing for the change of structural geometry (P-d and P-D effects) upon loading.

•    Calculate the bending moments about the element cross sectional axes, torsional moment about the longitudinal axis and axial force in the member, allowing for the second-order non-linear effects due to axial force. Shear will also be determined in the computer output.

•    Design a structure by section capacity check that effective length is not required to be assumed.

•    Check the instability of members as well as global structure.

•    Design the structure by a system approach, in contrast to the traditional “member-based” design method.

Second-order Elastic Analysis

In the design of steel structures by second-order non-linear analysis, the program increments the load in a step-by-step and incremental-iterative manner. Thus, a small increment of, say, from 5 to 25%, of expected design load is applied to the structure and the displacements are then computed and used to calculate the resistance. Iteration for equilibrium is carried out if they do not balance and convergence is assumed when the error of the norm of the unbalanced forces is smaller than 0.1% of the applied force. After convergence, the section capacity is checked for each member using Equation below. When any one of the members fails to meet the section capacity check, it is considered to have failed and it is then indicated in red and shown in post-viewer. After this step, a new load increment is applied and the same iterative procedure is exercised. This incremental-iterative procedure is activated until the specified number of load increments has been applied and the analysis is completed or when divergence occurs. In the whole design and analysis process, no assumption of effective length is needed since the P-d and P-D effects have been considered in Equation below.

Second-order Plastic Analysis or Advanced Analysis

This type of second-order plastic or advanced analysis is similar to the above elastic analysis except it needs not stop at the first plastic hinge as its design resistant load. When a member fails, a hinge is inserted to the member end close to the hinge position and analysis continues until the collapse load is reached. The collapse load is taken as the load level which does not allow further load increase indicated as a curve reaches plateau, descends or stagnates in the load vs. deflection plot. In design, this collapse load should be greater than or equal to the factored design load in all load cases.

In Plastic Advanced “plastic element” analysis, when a member reaches its design resistance, the axial force and moments of the member are kept constant and not allowed to change with the increasing load. This implies additional loads will be re-distributed to other members.

In plastic advanced “plastic hinge” analysis, when a member reaches its design resistance, a plastic hinge will be inserted to the node close to the location of plastic moment.

Note that, in second-order elastic-plastic analysis, the load increment should be smaller and generally should be less than 1% of the expected design load. Also, the arc length plus minimum residual displacement method should be used with control parameters sufficiently smaller, normally between 2 to 3.

Vibration and Buckling Analysis

NIDA determines the natural frequency by lump mass or consistent mass assumptions and the eigen-value buckling load factor as follows.

•    For natural frequency analysis

    and    


•    For eigenvalue buckling analysis


Elastic or first-plastic-hinge design has been used for century and plastic analysis is mainly limited to portal frame design. While steel accepted for use in building structures is reasonably ductile and has a minimum elongation at fracture of 15%, the ignorance of favorable effect in redundant structures by using elastic analysis is unjustifiable and un-sustainable for several reasons as follows.

• The elastic analysis discourages engineers to design robust and redundant structure against local failure since the design stops at the first plastic hinge. The approach does not allow engineers to consider in an analysis the strength reserve after first yield of structures while redundant and robust structures do not fail at the first plastic hinge.

• Engineers quite often like to make use of ductility of steel in their design and, for extreme loads during rare events, elastic design is uneconomical and puts a consultant using the elastic design into a non-competitive position.

• From past record, one can hardly find frame failure initiated by formation of plastic hinges in beams. Inspection of steel structures after earthquake showed that member buckling and cracking at connections were more common but plastic hinge in beams was unusual. This indicates buckling and connection are two important aspects in structural steel design against collapse and design allowing for plastic behaviour and stress re-distribution is both a safe and a sensible direction for design.

• For design of structures under static loads, the authors suggest the use of P-Δ-δ plastic analysis in ultimate load design and P-Δ-δ elastic analysis for design under working loads, with both analyses allowing for mandatory frame and member imperfections. This ensures that the structure will not collapse under ultimate loads or yield to store energy under working load condition.

Total Load Cycles

It describes the number of total load cycles for the nonlinear analysis. The number is equal to the total number of load cycles required in the Analysis.

Maximum Iterations for each Load Cycle

It describes the maximum number of iteration for each load cycle in the analysis. If the equilibrium condition is satisfied before this number is reached or the iteration number is equal to this assigned iteration number, another load step will be imposed until the permitted number of load steps is reached. The tolerance for equilibrium check is 0.1 % by default. That is, when the Euclidean norms of the unbalanced displacements and the unbalanced forces are less than respectively 0.1 % of the total applied forces and the total accumulated displacements, the equilibrium condition is assumed to have been satisfied.

Number of Iterations for Tangent Stiffness Matrix

It describes the number of iterations for the tangent stiffness matrix to reform during the iterative process. When this number is specified to be very large or simply equal to the “maximum number of iterations for each load cycle” above, the iterative scheme will then become the modified Newton Raphson method. If the number here is specified as "1”, it becomes the Newton Raphson method. If the number is between these two extremes, the method is a mixed Newton-Raphson method. When compared to modified Newton Raphson method, the Newton Raphson method generally requires less number of iterations for convergence, but longer time for each iteration. It is recommended to use the Newton Raphson method.

Incremental Load Factor

This factor will be used as the first load factor used for the analysis and the load factor increment in subsequent analysis. It is different from the design load factor behind “header load” which is multiplied to the input load to obtain the design load vector and will not appear in the plotting of equilibrium or load-deflection curve with its value generally taken as, for example, 1.6 for wind, 1.4 for self-weight etc. The load factor described here is used as the ratio of the current applied load to the input design load. For example, if a structure yields at a load factor of 2.6, it means when the applied load is 2.6 of the design load, the structure yields.

Imperfection Method & Direction

It describes the direction of initial imperfection with different methods. It can be no initial imperfection, initial imperfection in one principal plane causing less severe effect than initial imperfection in both the principal planes. The minimum magnitude of initial imperfection is taken as 1/1000 of the member length if the initial imperfections are allowed. For some sections such as cold-formed sections, this value may not be adequate. For global imperfections of a structure, the notional force can be used in place of member imperfections.

Magnitude of Imperfection for Global Eigenvalue Mode

This value is the magnitude of imperfection when eigenvalue buckling mode is adopted. After the eigenvalue analysis, the eigen-mode is determined and a set of initial imperfection is determined for the structure with this mode shape. This number is for the magnitude (maximum) of the initial deflection for the eigen-mode which is then added to the initial geometry of the structure.

Sign in to your account