


Response spectrum analysis
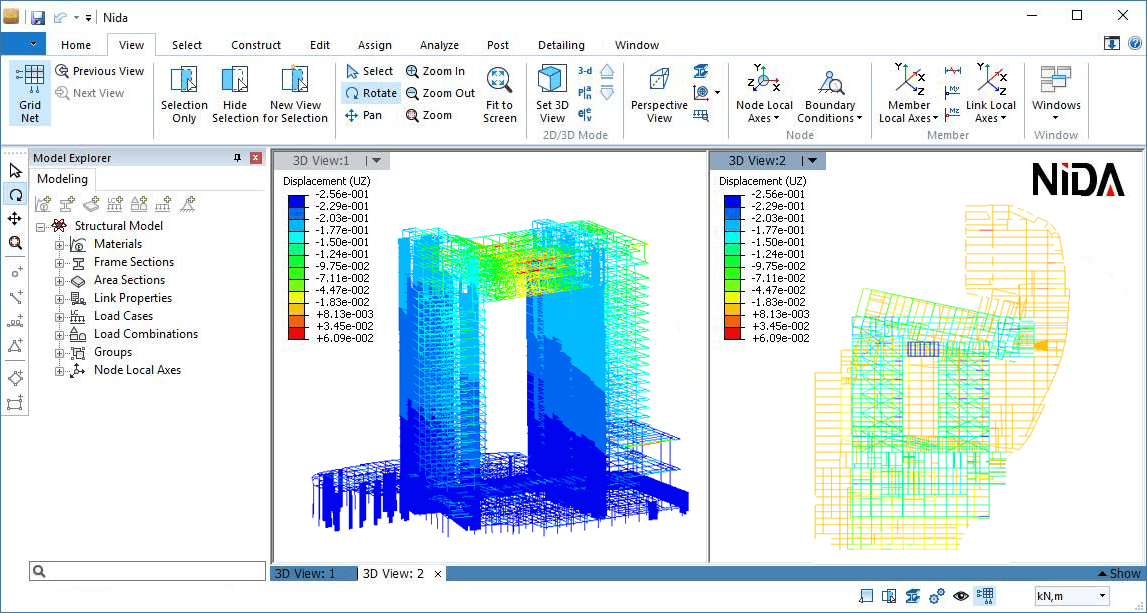
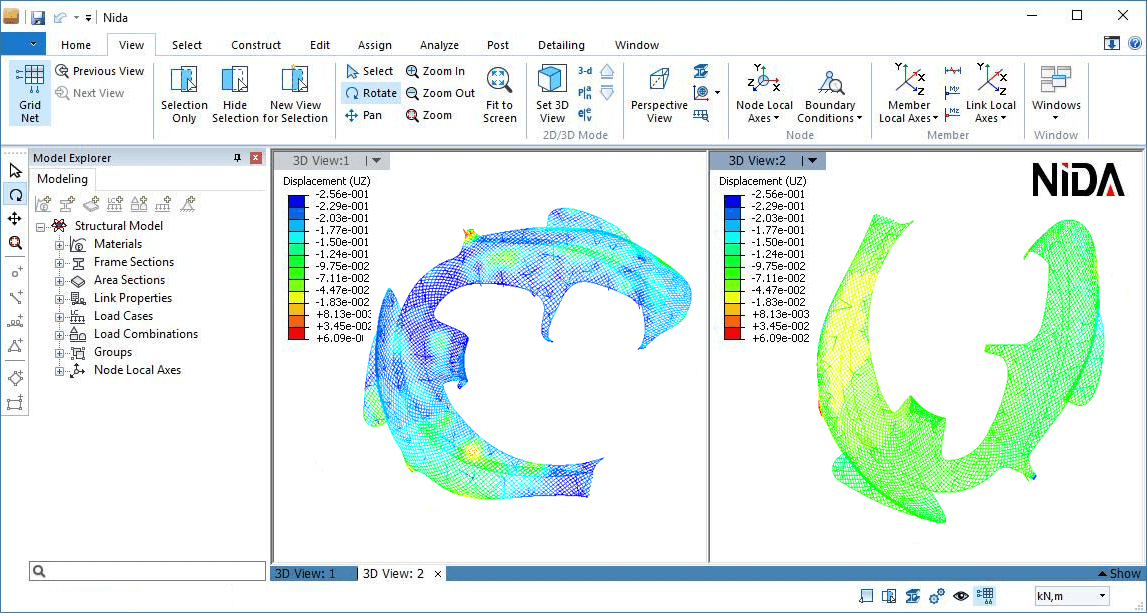
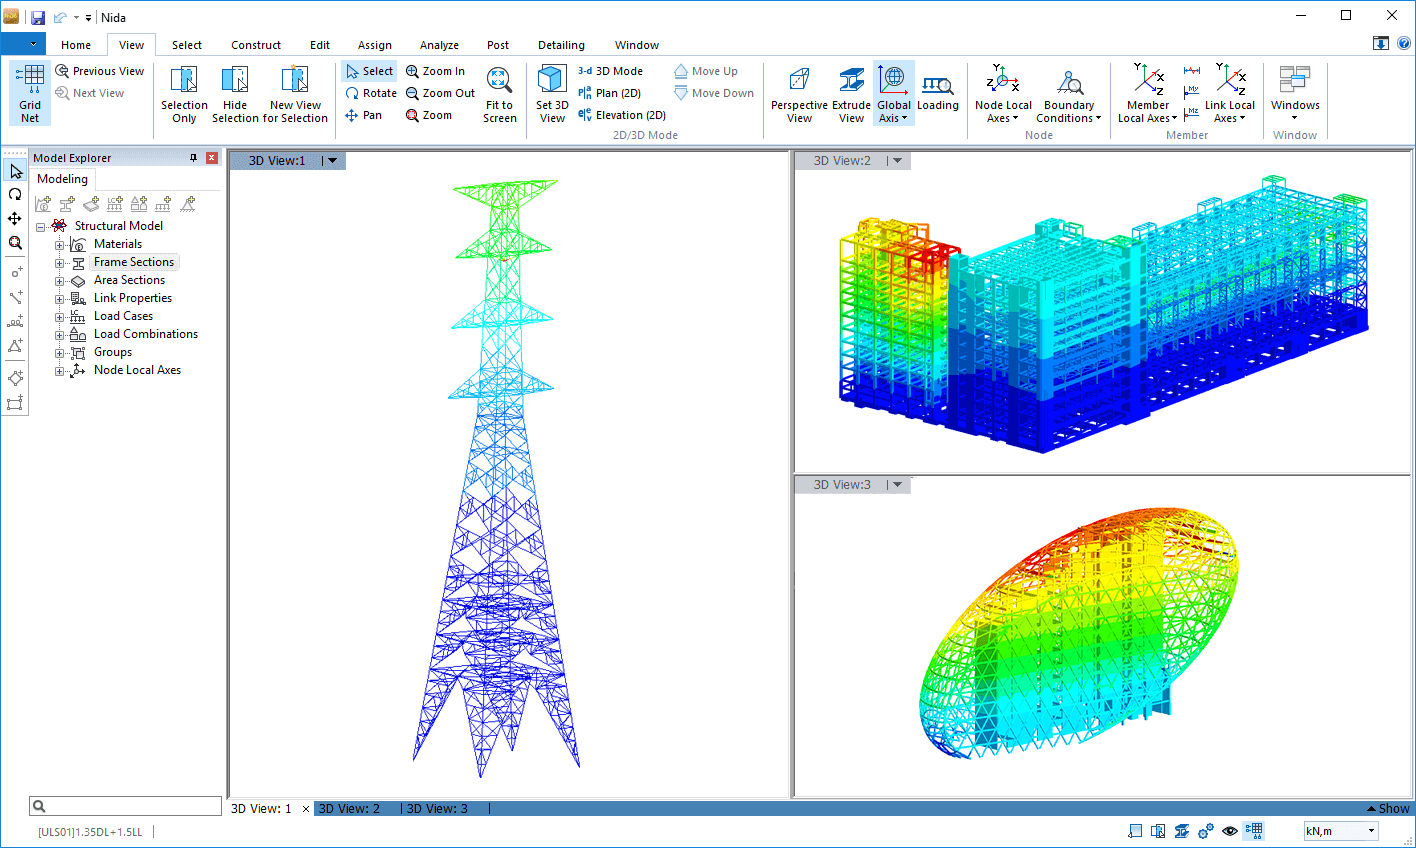
Response spectrum analysis is very useful for analyzing the performance of structures under earthquake. In NIDA, a modal analysis should be carried out to determine the 3D mode shapes and the natural frequencies of vibration. After that, the peak response of the building can be estimated by reading the value from the ground response spectrum for the appropriate frequency. In most building codes in seismic regions, this value forms the basis for calculating the forces that a structure must be designed to resist.
Modal combination methods such as CQC (Complete Quadratic Combination), SRSS (Square Root of the Sum of the Squares) and ABS (Absolute Sum) are available in NIDA.
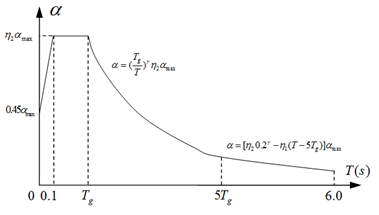
Figure1 Seismic influence coefficient curve (GB50011-2001)
Pushover analysis
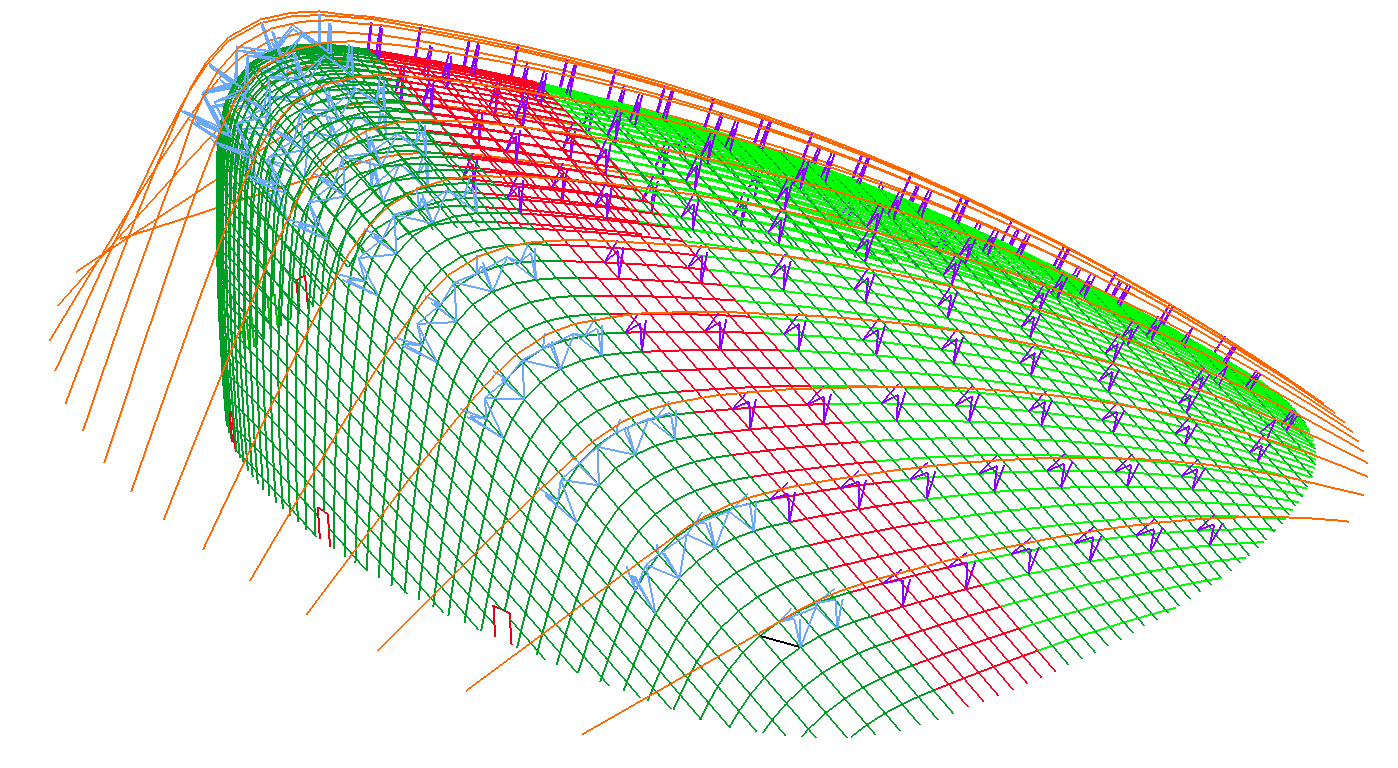
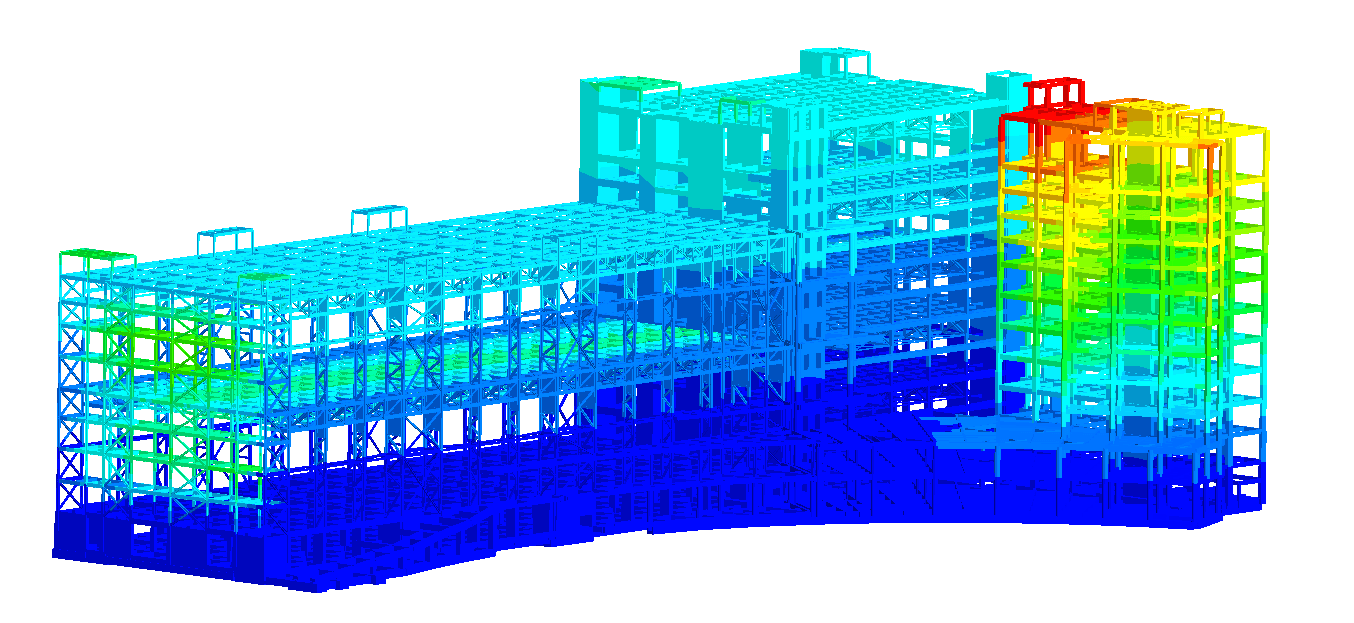
Nonlinear static (pushover) analysis is performed by applying monotonically increasing lateral forces, which represent the inertia forces to the nodes possessing mass in the possible seismic direction, with constant gravitational loads to the structure subjected to ground shaking.
The fundamental intent of the pushover analysis is to obtain the ‘capacity curve’, which shows the relationship between the roof displacement and the base shear.
Interestingly, the pushover procedure lacks a rigorous theoretical foundation. It is mainly relied on the assumption that the response of a multi degree-of-freedom (MDOF) system can be related to the response of an equivalent single degree-of-freedom (SDOF) system. The N2 method (Eurocode8, 2004), the Capacity Spectrum Method (ATC-40, 1997) and the Coefficient Method (FEMA356, 2000) are essentially based on the same assumption above, i.e., a MDOF system can be represented by an equivalent SDOF system, provided their response is dominated by a single mode.
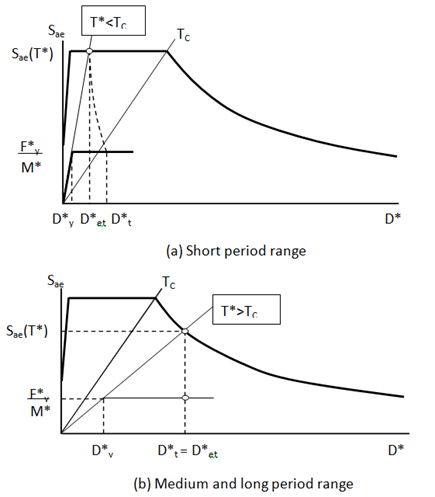
Figure2 Determine the Target Displacement for the SDOF System (Eurocode 8)
Time history analysis
The dynamic time history analysis is used to determine the dynamic response of a structure through the direct numerical integration of the dynamic equilibrium equations.
Unlike modal response spectrum analysis, which provides the best estimates of the peak response by statistical means such as the SRSS and the CQC rules, peak response quantities determined by dynamic time history analysis are exact, within the framework of the reliability and representativeness of the nonlinear modeling of the structure. The only drawbacks of the approach are its sophistication and the relative sensitivity of its outcome to the choice of input ground motions.
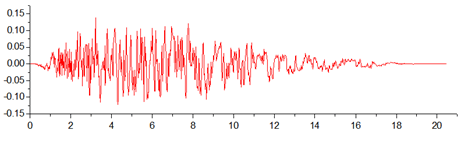
Figure3 A typical time history record